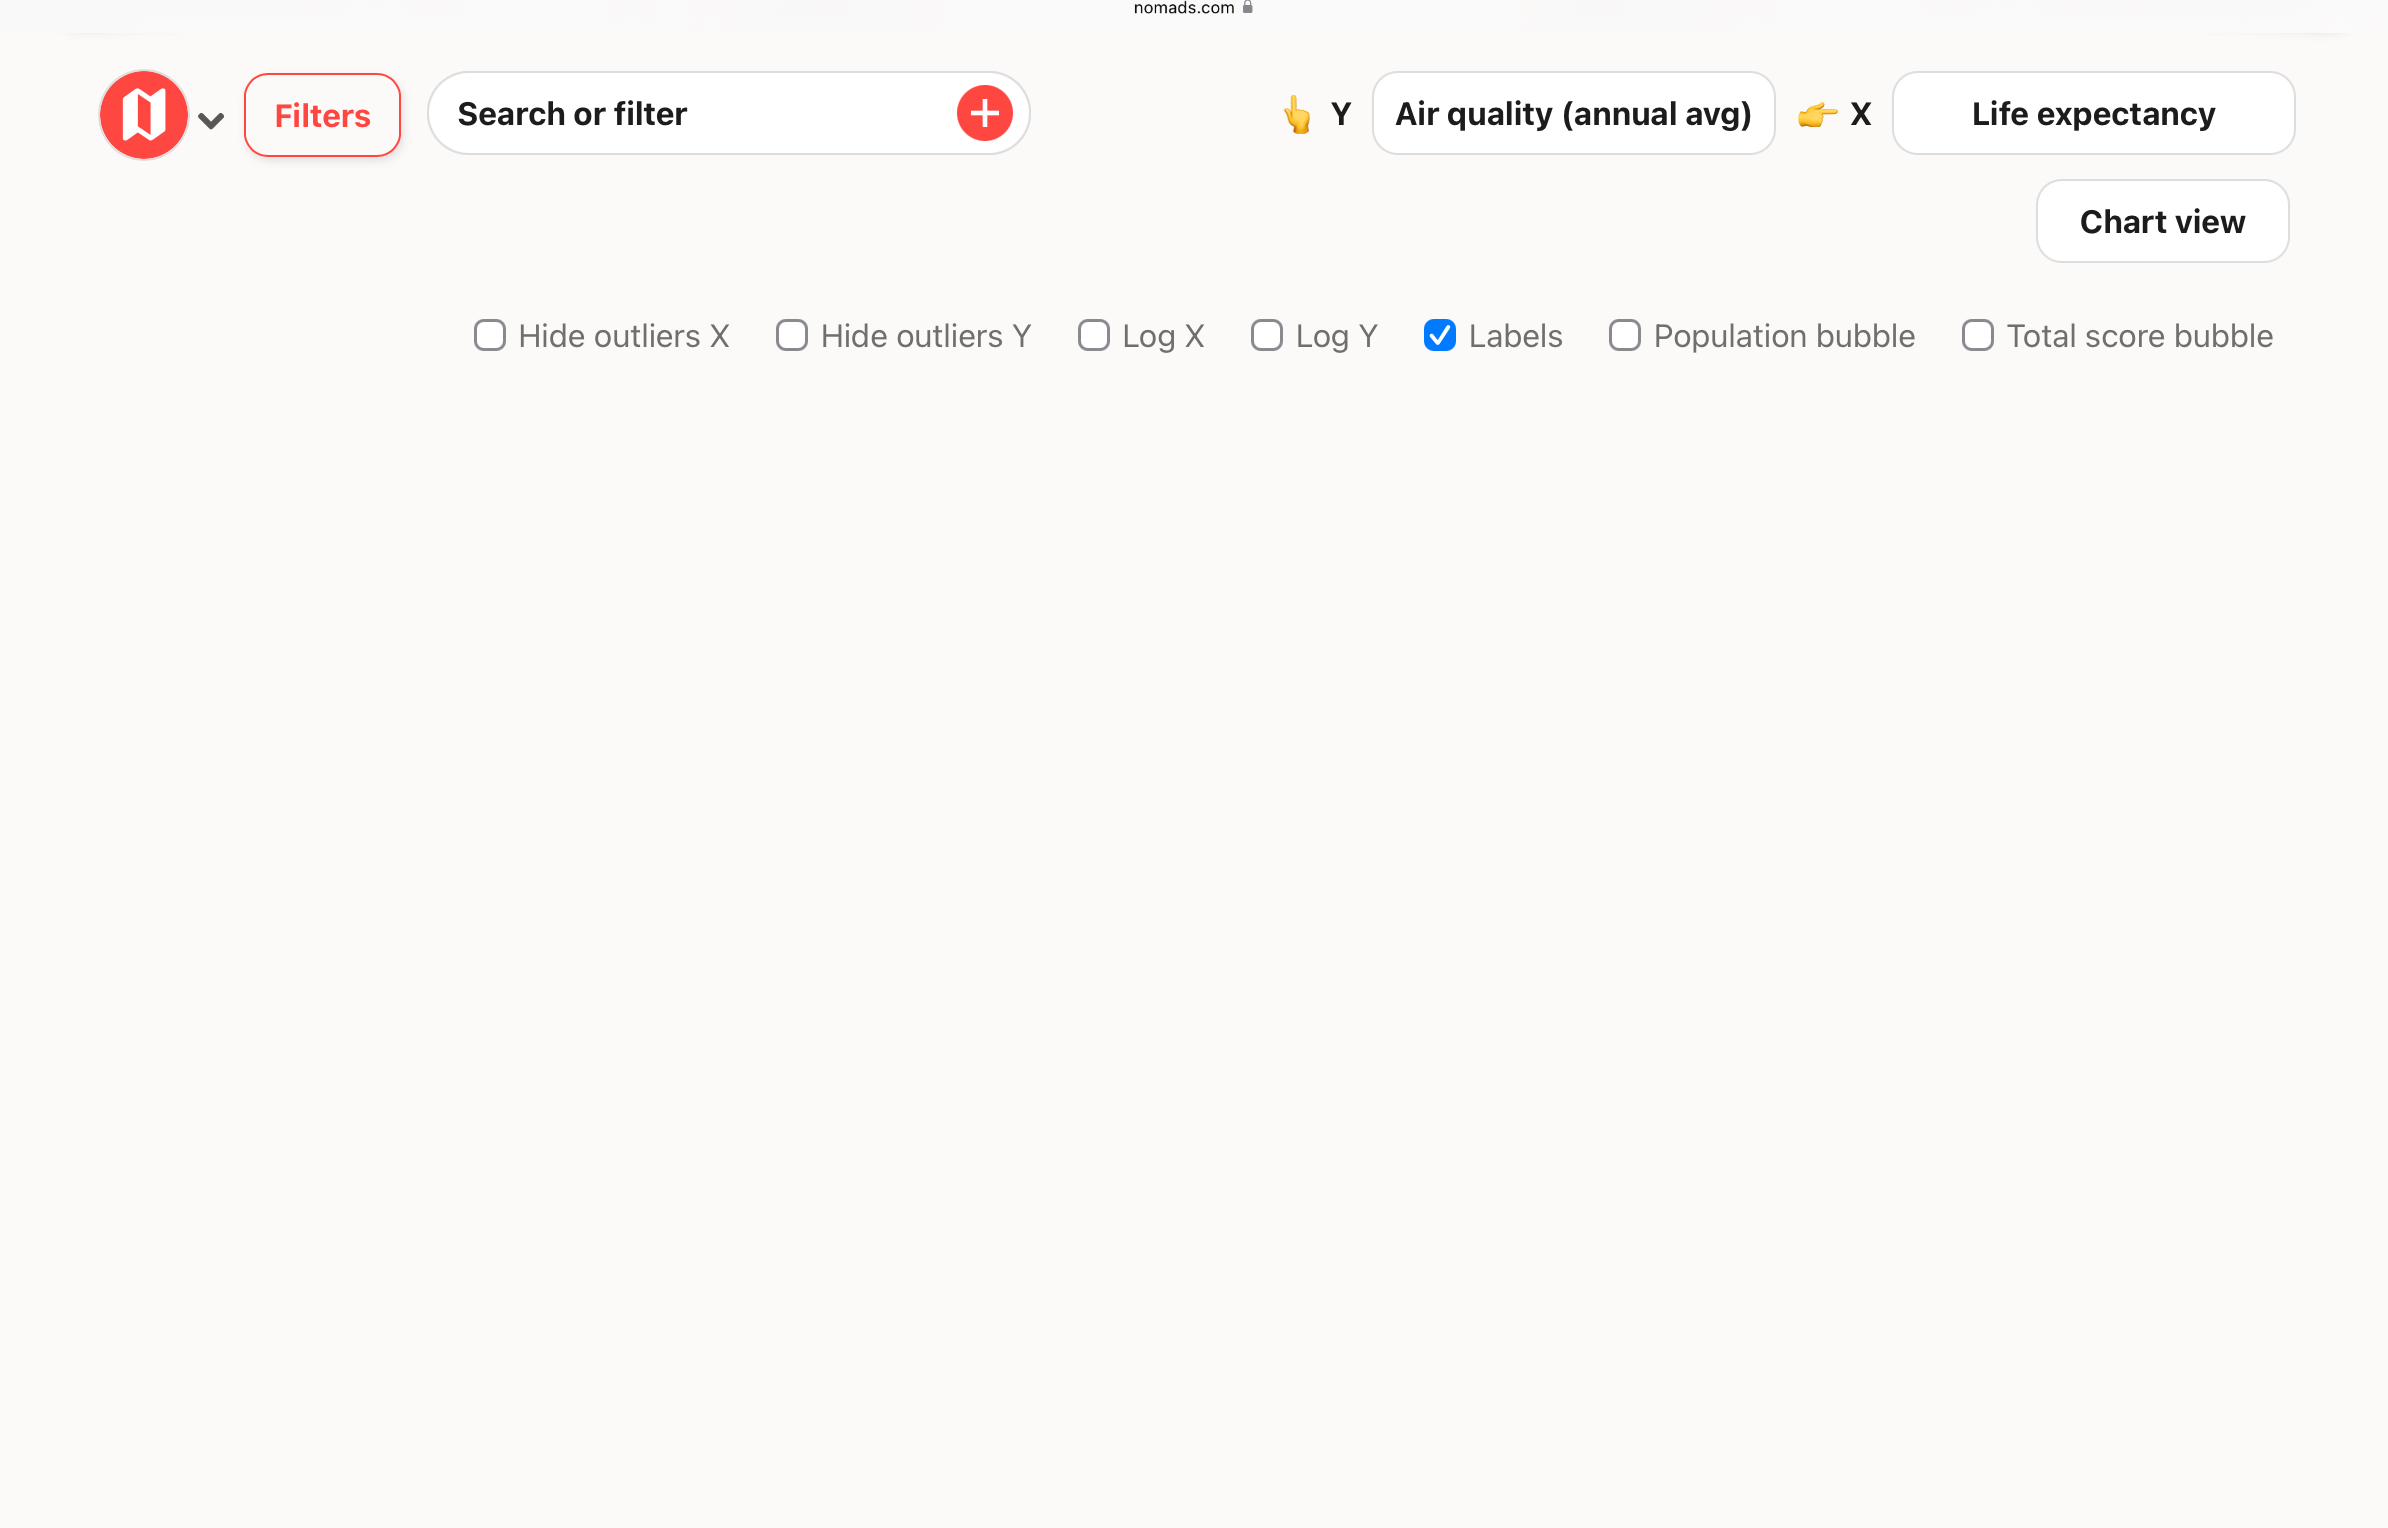
Chart View does not display
It is impossible to display the « Chart View » when selecting certain data on the x-axis, such as:
- Life Expectancy
- Median Age
- Temperature (now)
- Etc.
However, when selecting, for example, « Temperature (average) », the chart is displayed correctly.
Is this a bug or an intended feature?
Please authenticate to join the conversation.
Upvoters
Status
Completed
Board
🌍 Nomads.com
Date
About 1 year ago
Subscribe to post
Get notified by email when there are changes.
Upvoters
Status
Completed
Board
🌍 Nomads.com
Date
About 1 year ago
Subscribe to post
Get notified by email when there are changes.